Adds interactive charts that allows users to drill down into the data.
Features
- Support for .NET Core - Added components for creating, editing and viewing reports using this technology. .NET Core components are represented by a full-featured HTML5 viewer and report designer.
- TreeMap chart - When designing reports for data visualization you can now use a TreeMap chart. This diagram provides the ability to display a hierarchical view of the data.
- The Anchor property - When a report component is placed on another one, you can set the anchors of the component.
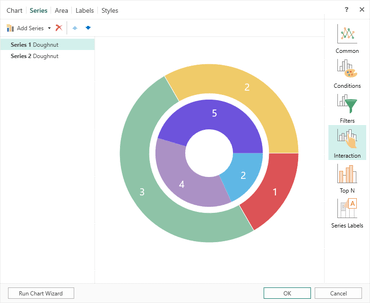
- Interactive charts - When developing reports you can now drill-down into charts.
- Group Sum in the map component - If you use the Map component in a report you can group data by countries or by continents, for example.
- Primitives - Primitives are report design elements. To add a horizontal, vertical line, rectangle, rounded rectangle to the report, go to the Insert tab, and, in the Shapes menu, select the corresponding element.
- Quiet Zone in barcodes - The quiet zone is a barcode separator for barcode readers.
- New properties to resize components - Specify the maximum and minimum sizes of report components. When rendering reports, the component can grow to the maximum or can decrease to the minimum value.
- New themes - Added 21 themes to the HTML5 viewer are added. This provides the ability to adjust the appearance of the viewer.