Map component now supports groupings, plus adds a new TreeMap chart type.
Features
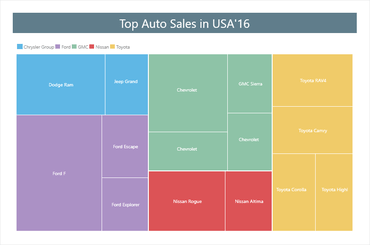
- TreeMap chart - When designing reports for data visualization you can now use a TreeMap chart. This diagram provides the ability to display a hierarchical view of the data.
- Anchor property - When a report component is placed on another one, you can set the anchors of the component.
- Group sum in the Map component - If you use the Map component in a report, you can group data by countries or by continents, for example.