Quantcast
Channel: ComponentSource News | Stimulsoft Reports.Ultimate
Viewing all 85 articles
Browse latest View live

Stimulsoft Reports improves WPF Designer

$
0
0

View reports using Stimulsoft Reports.

All methods that load resources or create interfaces now work asynchronously.

Stimulsoft Reports includes a set of tools to build reports in WinForms, ASP.NET, WPF, Silverlight, WinRT, Java, PHP and Flex environments. It includes report designers, which can be run at design and run time, as well as viewers for displaying reports. You can use the system to export reports in a number of different formats.

The following editions are available:

Updates in 2014.3

  • WPF Designer Improvements - All methods that load resources or create interfaces now work asynchronously.
  • Mobile Designer Improvements - You can now add system variables using the Mobile Designer.
  • Use Mobile Designer in Azure - Load the report designer in Azure and save on different server instances.
  • Report Checker for Expressions - New function checks expressions in the Report Checker. This is useful for those users who primarily work with other reporting tools that use a different syntax.
  • New Localizations - All Stimulsoft Reports products have been localized into Greek (el-GR).

About Stimulsoft

Stimulsoft specializes in the development of reporting components for the Microsoft.NET Framework. Customer satisfaction is the company's first priority and as such it aims to produce quality software. Stimulsoft helps developers to incorporate advanced technologies into their applications.


Stimulsoft Reports 2015.1 released

$
0
0

View reports using Stimulsoft Reports.

New version adds support for JSON data sources.

Stimulsoft Reports includes a set of tools to build reports in WinForms, ASP.NET, WPF, Silverlight, WinRT, Java, PHP and Flex environments. It includes report designers, which can be run at design and run time, as well as viewers for displaying reports. You can use the system to export reports in a number of different formats.

The following editions are available:

Updates in 2015.1

  • Support for JSON data sources.
  • Added interactive sorting, dynamic collapsing and drill down reports to the MVC Viewer component.
  • Redesigned UI.
  • Accelerated rendering of reports in cache mode by using multithreading.
  • Support for PDF/A-2 and PDF/A-3 standards.

About Stimulsoft

Stimulsoft specializes in the development of reporting components for the Microsoft.NET Framework. Customer satisfaction is the company's first priority and as such it aims to produce quality software. Stimulsoft helps developers to incorporate advanced technologies into their applications.

Stimulsoft Reports.Ultimate adds JavaScript and HTML5 support

$
0
0

Sample report created using Stimulsoft Reports.JS.

Deploy your reports anywhere, on any device.

Stimulsoft Reports.Ultimate includes a set of tools to build reports in JavaScript, ASP.NET, ASP.NET MVC, WPF, Silverlight, WinRT, HTML5, Windows Forms, PHP, Java, and Flex.environments. It includes report designers, which can be run at design and run time, as well as viewers for displaying reports. You can use the system to export reports in a number of different formats.

Updates in 2015.2

  • Stimulsoft Reports.JS - A simple and flexible solution for working with reports using JavaScript and HTML5.
  • SQL Parameters in Mobile Designer - Create SQL queries using parameters.
  • Editable Reports in Mobile Viewer- You can now edit reports in the HTML5 viewer.
  • Search Panel in Mobile Viewer - A fully functional search bar has been added to the HTML5 viewer.
  • Support for MongoDB - Now you can use MongoDB data sources when creating reports.
  • OData Adapter - Retrieve data using the OData protocol, including using REST requests and parameters.
  • Built-in Data Adapters - All external adapters are now grouped and embedded into the report engine.
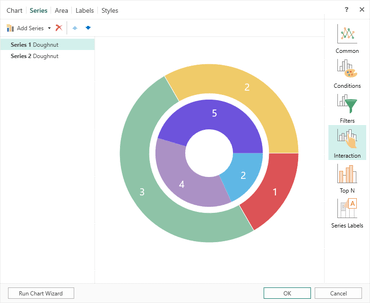
  • New Settings for Chart Styles - New functionality added for adjusting chart styles including areas, series labels, legends, axes and grid lines.
  • Center Align Axis Labels - Added the ability to center align axis labels when using word wrap.
  • New Interaction Editor - New editor contains report commands and parameters making it much easier to create interactive reports.
  • Save Reports in JSON - You can now save both report templates and rendered reports.
  • WPF Gauge Component - Display a specific value from a range of values.
  • Chart Animation for WPF and Web - Increase the attractiveness of reports with chart animations.
  • New WPF Text Editor - The text editor can contain text, expressions or references.
  • New Export Formats for Java, PHP and Flex - You can now export reports to Excel 2007/2013.

About Stimulsoft

Stimulsoft specializes in the development of reporting components for the Microsoft.NET Framework. Customer satisfaction is the company's first priority and as such it aims to produce quality software. Stimulsoft helps developers to incorporate advanced technologies into their applications.

Stimulsoft Reports.Ultimate adds WPF Maps

$
0
0

A sample map created using Stimulsoft Reports.Ultimate.

Visualize geographical data in your reports.

Stimulsoft Reports.Ultimate includes a set of tools to build reports in JavaScript, ASP.NET, ASP.NET MVC, WPF, Silverlight, WinRT, HTML5, Windows Forms, PHP, Java, and Flex.environments. It includes report designers, which can be run at design and run time, as well as viewers for displaying reports. You can use the system to export reports in a number of different formats.

Updates in 2015.3

  • JavaScript Report Engine in PHP - The PHP reporting controls now contain an HTML5 viewer and designer. They are no longer limited by Flash technology.
  • New WPF Maps - Visualize geographical data in your reports.
  • Variables in Queries - Reports.Net and Reports.Wpf can now use variables to make queries easier.
  • Drag and Drop Components in HTML5 Designer - Reports.Web now includes the ability to drag components from the Insert tab directly into a report template.
  • Primitives Exporting - In Reports.Net, Reports.Wpf and Reports.Web all barcodes and shapes are now exported as primitives rather than images.
  • Data Sources in Reports.JS - Data can now be obtained from an OData data source, Excel file, Firebird, MS SQL or MySQL database.
  • Expressions for JSON and XML in Reports.JS - Now supports expressions that enable you to create a JSON or XML data source.
  • Barcodes in Reports.JS - Supports more than 30 types, including QR Code barcodes.
  • Touch Interface in Reports.Java - You can now easily view reports, navigate and export, using your mobile device.

About Stimulsoft

Stimulsoft specializes in the development of reporting components for the Microsoft.NET Framework. Customer satisfaction is the company's first priority and as such it aims to produce quality software. Stimulsoft helps developers to incorporate advanced technologies into their applications.

Stimulsoft Reports.Net 2016.2

$
0
0
Stimulsoft Reports.Net

The reporting tool can now request only the data needed for the report, plus adds new watermarking features.

Features

  • Retrieve Used Data Only - The reporting tool can now request only the data needed for the report.
  • Query Timeout Parameter - Now you can specify the time after which a Query Timeout error message will be thrown.
  • Embedded Files When Exporting to PDF - You can now export a report to PDF and embed other files in this document.
  • Support for ZUGFeRD in .NET Products - Export reports to PDF using the ZUGFeRD standard. This standard is designed for electronic invoices. At the same time, the report will be converted to the PDF specification PDF/A-3, and an XML file with the invoice data will be embedded into the PDF document.
  • Expressions Watermarks - A report watermarks can now be the result of an expression.
  • Conditional Enabling/Disabling of Watermarks - A watermark can be included under certain conditions.

Stimulsoft Reports.Ultimate 2016.2

$
0
0
Stimulsoft Reports.Ultimate

Web Viewer handles larger reports, improved error checking, security, watermarking and PDF export features.

Features

  • Report Checker in Reports.Web and Reports.JS - Now, in the HTML5 Report Designer, you can check the report for errors and get a variety of recommendations to improve the report.
  • Report Encryption in Reports.Web and Reports.JS - Now reports can be password protected.
  • Retrieve Used Data Only - The reporting tool can now request only the data needed for the report.
  • Reimagined Web Viewer - The WebViewer component has improved the speed of report processing and has been optimized to work with large reports.
  • Updated WebViewerFx in Reports.Web - The updated component has standardized event names and properties and implements general report processing algorithms with the Web Viewer. Report caching algorithms has also been updated.
  • Query Timeout Parameter - Now you can specify the time after which a Query Timeout error message will be thrown. This property is not available in Reports.Java.
  • Embedded Files When Exporting to PDF - You can now export a report to PDF and embed other files in this document.
  • Support for ZUGFeRD in .NET Products - Export reports to PDF using the ZUGFeRD standard. This standard is designed for electronic invoices. At the same time, the report will be converted to the PDF specification PDF/A-3, and an XML file with the invoice data will be embedded into the PDF document.
  • Expressions Watermarks - A report watermarks can now be the result of an expression. This option is not available in Reports.Java.
  • Conditional Enabling/Disabling of Watermarks - A watermark can be included under certain conditions. This feature is available in Reports.Web, Reports.JS, Reports.Net, Reports.Wpf.
  • Improved Calendar in Reports.Web and Reports.JS - When using a Date Range in a report you can now select a specific range of dates or relative values.
  • Updated Style Designer in Reports.Web and Reports.JS - Commands for working with the clipboard have been added. Also, the add style menu was redesigned.
  • Conditions in Styles in Reports.Web - Conditions can be set depending on location, type or name of the component to which this style will be applied.
  • Report Tree in HTML5 Designer in Reports.Web and Reports.JS - The Report tree panel has been added to the Report Designer. This panel visually displays the hierarchy of the components in a report.
  • Mirror Fields in Reports.Web and Reports.JS - To activate the mirror fields, you need to select the Mirror Margins parameter in the page properties.
  • The New Item in the File Menu in Reports.Web and Reports.JS - Stimulsoft have added a new Info item on the File menu. This section contains the main opportunities to work with the report.
  • Report Globalization in Reports.Web - Localize a report into multiple languages. When rendering a report, the reporting tool will check the culture of the installed operating system.
  • Copying Components with the Ctrl Key in Reports.Web and Reports.JS - To do this, select the component, hold down the Ctrl key and move the component with the cursor.
  • Set Report Culture in Reports.Web and Reports.JS - Many report elements depend on a selected culture. Localization of system variables in the designer and in the viewer, the date and time formatting and many more.
  • Interactive Sorting in Reports.JS - Allows you to change the order of data during the report creation process.
  • Collapsing in Reports.JS - Expand and collapse lists and groups in the viewer window.
  • Drill-Down Reports in Reports.JS - Create interactive reports with drill-down features.
  • Virtual Data Source in Reports.JS and Reports.Java - Create a virtual data source and build a report in the Report Designer.
  • Adapters of Data Sources in Java - In the current release of Reports.JS we added support for database adapters in Java for the server side. Currently the following adapters are supported - Firebird, MySQL, Oracle, PostgreSQL, MS SQL.
  • Oracle Data Source in Reports.JS, Reports.Java, and Reports.PHP - It is now possible to generate reports form Oracle data sources.
  • Export to Excel or CSV in Reports.JS - Specify the encoding, data separator, and choose the report items that need to be converted.
  • Charts and Barcode When Exporting to PDF in Reports.JS - This release finalizes PDF export. Now reports with charts and barcodes can be converted to PDF.
  • Cross-tab Editor in Reports.Java and Reports.JS - The 2016.2 release now has the cross-tab editor in the report designer. You can now view reports with the cross-tab component and also to create them.
  • Histogram Conditions in Reports.JS - Visually display the dynamics of change in the values of columns.
  • Conditions in the Color Scale in Reports.JS - Highlight the color of the components depending on their value.
  • Icon Set Condition in Reports.JS - It is now possible to highlight a component with an icon depending on its value.
  • The Events Tab in Reports.JS - The Events Tab contains a list of report events for that selected component.
  • Support for the Table component in Reports.Java and Reports.Web - A table consists of cells which are formed at the intersection of rows and columns. These cells contain various data such as text, expressions, reference to data columns, RichText, image, checkbox.
  • Grid in Reports.Java - This release adds the ability to display a grid on the page.
  • Styles by Dragging the Data Source in Reports.Java - Define a report’s style when creating its structure.
  • Text Formatting in Reports.Java - You can set up a simple, numerical, currency, date or time format, percent, Boolean or set a custom format.
  • Calculated Data Column in Reports.Java - The value may be specified as an expression, in particular, and with reference to other elements of the data dictionary such as data column, variables, etc.
  • The Range of Dates in Reports.Java - When you use a variable in a report, you can specify not only a specific date but a specific date range. You can create reports that will display information for a specific time period.
  • Compatibility with Java Server Faces in Reports.Java - Reports.Java is fully compatible with Java Server Faces (from version 2.2).
  • Break if True in Reports.Java - When using multi-level conditions in a report you can break the processing of report conditions.
  • Styles for Charts in Reports.Java - You can now create styles for charts.
  • MS SQL Data Source in Reports.Java - Now you can create a MS SQL data source and generate reports based on this source.

Stimulsoft Reports for Flex 2016.3

$
0
0
Stimulsoft Reports for Flex

Improves XML exporting.

Features

  • Filtering Data when Exporting to XML - Now when you export reports to XML, you can filter which bands are to be included. The following options are available - data only, data and headers and all report bands.

Fixes

  • Error when loading report with certain parameters in Conditions in the Flash Designer.
  • Drill-down and parameters panel drawing for Office2013 theme in Flash Viewer.
  • Bug with small wisywig text in Flash Designer.

Stimulsoft Reports for Java 2016.3

$
0
0
Stimulsoft Reports for Java

Added the ability to encrypt reports in the Designer.

Features

  • Added the report tree to the Designer.
  • Added CommandTimeout properties to the edit form for SQL datasources.
  • Added report culture property to the Designer.
  • Added the ability to encrypt reports in the Designer.
  • Added the report checker to the Designer.
  • Added the Globalization editor to the Designer.

Fixes

  • Datetime parameters in the DB query.
  • The error when loading report with certain parameters in Conditions in the Flash Designer.
  • The nullable variables in WebViewer and WebDesigner.
  • Nullable variables.
  • Drill-down and parameters panel drawing for Office2013 theme in Flash Viewer.
  • Remove SYS elements from the Create Datasource wizard.
  • A bug with small wisywig text in Flash Designer.
  • The WebDesigner Image component.

Stimulsoft Reports for PHP 2016.3

$
0
0
Stimulsoft Reports for PHP

Includes several bug fixes for UTF-8 data and UTF-8 encoding.

Fixes

  • Fixed problem with UTF-8 data in certain types of the Firebird database fields.
  • Fixed problem with UTF-8 encoding when using the MSSQL adapter.

Stimulsoft Reports.JS 2016.3

$
0
0
Stimulsoft Reports.JS

Added support for encrypting reports in the JS Designer.

Features

  • When creating an XML data source, you can now attach a file with the XML data schema.
  • Create a data source based on a CSV file.
  • You can now use Cross-Data, Cross-Header, Cross-Footer, Cross-Group Header and Cross-Group Footer bands in the development of reports.
  • Authenticate OData connections.
  • Support for encrypting reports in the JS Designer.

Stimulsoft Reports.Net 2016.3

$
0
0
Stimulsoft Reports.Net

Adds the ability to use resources when connecting to data, plus support for Visual Studio 2017 RC.

Features

  • Added the ability to use resources when connecting to data.
  • Support for Microsoft Visual Studio 2017 RC.
  • Redesigned Image Editor.
  • Drag images, fonts, mrt, mrz and rtf files to the data dictionary.
  • Redesigned the image variable form.
  • Redesigned the page watermark form.

Fixes

  • Empty table "Table1" when using JSON data.
  • Fixed some minor bugs in export forms.
  • Fixed a bug selecting the connection in the data source edit form.

Stimulsoft Reports.Ultimate 2016.3

$
0
0
Stimulsoft Reports.Ultimate

Adds support for Microsoft Visual Studio 2017 RC.

Features

  • Support for Microsoft Visual Studio 2017 RC.
  • Report Resources - Include a variety of files in reports (Reports.Net, Reports.Web, Reports.Wpf).
  • Images in Resources - Images of different types can be included in your reports (Reports.Net, Reports.Web, Reports.Wpf).
  • Data from Files in Saved Resources - You can now include data from files in reports (Reports.Net, Reports.Web, Reports.Wpf).
  • Image Variables - Added a new Image type variable that allows images to be stored in the variable (Reports.Net, Reports.Web, Reports.JS, Reports.Wpf).
  • Gallery in Image Editor - Show a list of thumbnails of all available images (Reports.Net, Reports.Web, Reports.Wpf).
  • Updated Watermark Editor - All images added as resources or stored in variables can now be used as watermark images (Reports.Net, Reports.Web, Reports.Wpf).
  • Import Reports from the Designer - Previously, separate tools were available to convert reports to the Stimulsoft internal format. You can now do this directly in the report designer (Reports.Net, Reports.Web, Reports.Wpf).
  • XML Schemas - When creating an XML data source, you can now attach a file with the XML data schema (Reports.JS).
  • CSV Data Sources - Create a data source based on a CSV file (Reports.JS).
  • Cross Bands - You can now use Cross-Data, Cross-Header, Cross-Footer, Cross-Group Header and Cross-Group Footer bands in the development of reports (Reports.JS).
  • Authenticate OData connections (Reports.Web and Reports.JS).

Stimulsoft Reports.Web 2016.3

$
0
0
Stimulsoft Reports.Web

Adds support for connecting resources to CSV, DBF, Excel, JSON and XML data.

Features

  • Support for Microsft Visual Studio 2017 RC.
  • Added GlobalReportCache property to the StiWebViewerFx.
  • Added ID parameter to the MvcViewerFx and MvcDesignerFx.
  • Support for dictionary resources in the Designer.
  • Added Band Filtering when exporting to XML.
  • Support for image hyperlinks from resources and variables in page watermarks.
  • Support for connecting resources to CSV, DBF, Excel, JSON and XML data in the Designer.
  • Added OData connection edit form to the Designer.
  • Drag & drop csv, xls, xlsx, dbf, json, xml files in the dictionary.
  • Support for SegmentPerWidth & SegmentPerHeight pages properties in the Designer.

Fixes

  • Fixed bug with the disappearance of the pages panel after preview in the Designer.
  • Fixed bug disabling all controls after closing a report in Designer.
  • Fixed error when loading report with certain parameters in Conditions in the Flash Designer.
  • Fixed bug with tooltips in the Viewer.
  • Fixed bug with zoom menu in the viewer.
  • Fixed empty preview window without special action in the MvcDesignerFx.
  • Fixed bug with chart areas properties in the Designer.
  • Fixed bug with small text in the Flash Designer.

Stimulsoft Reports.Wpf 2016.3

$
0
0
Stimulsoft Reports.Wpf

Adds support for Microsoft Visual Studio 2017 RC.

Features

  • Support for Microsoft Visual Studio 2017 RC.
  • Report Resources - Include a variety of files in reports.
  • Images in Resources - Images of different types can be included into your reports.
  • Data from Files in Saved Resources - You can include data files in reports.
  • Image in Variable - Added a new Image type variable. Now, an image may be stored in the variable.
  • Gallery in Image Editor - Show a list of thumbnails of all available images.
  • Updated Watermark Editor - All images added as resources or stored in variables can now be used as watermark images.
  • Importing Reports - Previously, separate tools were available to import reports to the Stimulsoft internal format. You can now do this directly in the report designer.

Fixes

  • Column lines of the page were not shown.
  • Empty table "Table1" when using JSON data.
  • Some minor bugs in export forms.

Stimulsoft Reports for Java 2017.1

$
0
0
Animation of charts is Reports.Java.

Adds animation of report charts and the ability to export reports to OpenDocument Calc and Writer formats.

Features

  • XSD schemas in Reports.Java - Previously, the structure for XML data could only be obtained from an XSD file. You can now also get a structure for the XML data source from another XML file.
  • Animation of charts is Reports.Java - This feature increases the attractiveness of reports with charts.
  • New exports in Reports.Java - Reports can be converted to OpenDocument Calc and OpenDocument Writer.
  • Copying components in Reports.Java
  • Conditions for styles in Reports.Java - By default, the styles from the list are applied sequentially to the report components. If you use a collection of styles, the last style of the collection will be applied to the report components. However, when using the style conditions, you can define the settings by which this style will be applied.
  • Mirror fields in Reports.Java - Now you can create reports with bindings. To enable mirroring mode, set the Mirror Margins property to true.
  • New parameters of the data dictionary in Reports.Java - Two parameters have been added in the data dictionary - Create Label and Create Field on Double Click.

Stimulsoft Reports for PHP 2017.1

$
0
0
New themes in Stimulsoft Reports for PHP.

Adds 21 new themes to the HTML5 viewer - to adjust the viewer appearance.

Features

  • New themes - Added 21 new themes to the HTML5 viewer. This provides the ability to adjust the appearance of the viewer.

Stimulsoft Reports.JS 2017.1

$
0
0
Quiet Zone in barcodes.

Adds design primitives and barcode quiet zones - to separate barcodes, for barcode readers.

Features

  • Primitives - Primitives are design elements of a report. To add a horizontal, vertical line, rectangle, rounded rectangle to the report, go to the Insert tab, and, in the Shapes menu, select the corresponding element.
  • Open button - Using this option you can load a previously rendered and saved report.
  • Quiet Zone in barcodes - The quiet zone is a barcode separator for barcode readers. Now when creating reports, you can enable or disable the quiet zone of the barcode.
  • Resize components - Specify the maximum and minimum size of report components. When rendering reports the components can grow to the maximum or decrease to the minimum value.
  • New themes - Added 21 themes for the HTML5 viewer. This provides the ability to adjust the appearance of the viewer.

Stimulsoft Reports.Net 2017.1

$
0
0
TreeMap chart.

Adds a TreeMap chart type diagram for a hierarchical view of the data in your reports.

Features

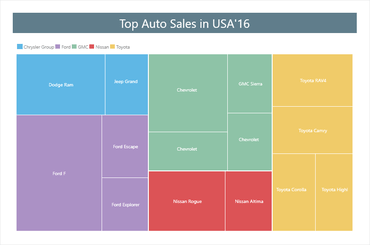
  • The TreeMap chart - When designing reports for data visualization you can now use the TreeMap chart. This diagram provides the ability to display a hierarchical view of the data.
  • The Anchor property - When a report component is placed on another one, you can set the anchors of the component.
  • Group Sum in the Map component - If you use the Map component in a report, you can group data by countries or by continents, for example.

Stimulsoft Reports.Web 2017.1

$
0
0
Interactive charts.

Adds interactive charts that allows users to drill down into the data.

Features

  • Support for .NET Core - Added components for creating, editing and viewing reports using this technology. .NET Core components are represented by a full-featured HTML5 viewer and report designer.
  • TreeMap chart - When designing reports for data visualization you can now use a TreeMap chart. This diagram provides the ability to display a hierarchical view of the data.
  • The Anchor property - When a report component is placed on another one, you can set the anchors of the component.
  • Interactive charts - When developing reports you can now drill-down into charts.
  • Group Sum in the map component - If you use the Map component in a report you can group data by countries or by continents, for example.
  • Primitives - Primitives are report design elements. To add a horizontal, vertical line, rectangle, rounded rectangle to the report, go to the Insert tab, and, in the Shapes menu, select the corresponding element.
  • Quiet Zone in barcodes - The quiet zone is a barcode separator for barcode readers.
  • New properties to resize components - Specify the maximum and minimum sizes of report components. When rendering reports, the component can grow to the maximum or can decrease to the minimum value.
  • New themes - Added 21 themes to the HTML5 viewer are added. This provides the ability to adjust the appearance of the viewer.

Stimulsoft Reports.Wpf 2017.1

$
0
0
TreeMap chart.

Map component now supports groupings, plus adds a new TreeMap chart type.

Features

  • TreeMap chart - When designing reports for data visualization you can now use a TreeMap chart. This diagram provides the ability to display a hierarchical view of the data.
  • Anchor property - When a report component is placed on another one, you can set the anchors of the component.
  • Group sum in the Map component - If you use the Map component in a report, you can group data by countries or by continents, for example.
Viewing all 85 articles
Browse latest View live


<script src="https://jsc.adskeeper.com/r/s/rssing.com.1596347.js" async> </script>