Support for .NET Core in Reports.Web.Adds support for .NET Core components in Reports.Web - with an HTML5 viewer and report designer.
Features
- Install using extensions - Install Stimulsoft products using NuGet, Maven, and NPM extensions
- Support for .NET Core in Reports.Web - Create, edit and view reports using this technology. .NET Core components are represented by a full-featured HTML5 viewer and report designer.
- The TreeMap chart in Reports.Net, Reports.Web, Reports.Wpf - When designing reports for data visualization you can now use the TreeMap chart. This diagram provides the ability to display a hierarchical view of the data.
- The Anchor property in Reports.Net, Reports.Web, Reports.Wpf - When a report component is placed on another one you can set the anchors of the component.
- Interactive charts in Reports.Web - When developing reports you can now create reports that let users drill-down into the data.
- Group Sum in the Map component in Reports.Web Reports.Net, Reports.Wpf - If you use the Map component in a report you can group data by countries or by continents, for example.
- Primitives in Reports.JS, Reports.Web - Primitives are report design elements. To add a horizontal, vertical line, rectangle, rounded rectangle to the report, go to the Insert tab, and, in the Shapes menu, select the corresponding element.
- Open button in the Reports.JS viewer - Using this option, you can load a previously rendered and saved report.
- Quiet Zone in barcodes in Reports.JS, Reports.Web - The quiet zone is a barcode separator for barcode readers
- Resize components in Reports.JS, Reports.Web - Specify the maximum and minimum sizes of report components. When rendering reports the component can grow to the maximum or can decrease to the minimum value.
- XSD schema in Reports.Java - Previously, the structure for XML data could only be obtained from an XSD file. Starting with 2017.1, you can also get a structure for the XML data source from another XML file.
- Animation of charts is Reports.Java - This feature increases the attractiveness of reports with charts.
- New exports in Reports.Java - Can be converted to OpenDocument Calc and OpenDocument Writer formats.
- Copying components in Reports.Java - One of the ways to copy components can be applied by using the Ctrl key. To do this, select the component, hold down the Ctrl key and do not release it. Drag the component. In this case, the component itself and all other components that are located on it will be copied.
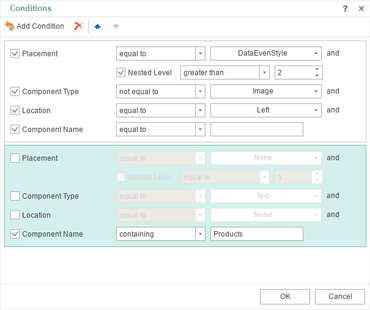
- Conditions for styles in Reports.Java - By default, the styles from the list are applied sequentially to report components. If you use a collection of styles, the last style of the collection will be applied to&; report components. However, when using the style conditions, you can define the settings by which this style will be applied.
- New themes for the Reports.JS, Reports.Web, and Reports.PHP viewers - Added 21 themes for the HTML5 viewer. This provides the ability to adjust the appearance of the viewer.
- Mirror fields in Reports.Java - Now you can create reports with bindings.
- New data dictionary parameters in Reports.Java - Two new parameters have been added to the data dictionary - Create Label and Create Field on Double Click.
↧
Report publishing wizard.Includes new publishing wizard for integrating reports into applications on various platforms.
Features
- Publishing Reports - A new report publishing wizard has been added to the report designer. It helps the process of integrating reports into applications on various platforms.
- Stimulsoft Cloud - New cloud-based service for creating, storing, and deploying reports in your applications.
- Store Reports in Stimulsoft Cloud - Save reports from the standalone report designer to Stimulsoft Cloud.
- New Product Stimulsoft Reports.UWP - Includes a report designer and viewer.
- SVG Images - You can now use SVG images in reports.
- JS Preview in Designer - When developing reports in the WinForms and WPF report designers, you can now preview the report in a JavaScript viewer.
- New WebDesigner Component - This component is a universal full-featured tool for creating reports. It was developed using HTML5 and CSS3 technologies and supports any web browser.
- Added Page Tab to Web Designer - This tab contains commands to quickly manage report templates. You can define page borders, orientation, size, add columns to the page, call the watermark editor, enable displaying a grid, align the selected components to the grid, hide or show the headers of components (Feature added to Reports.Web, Reports.JS, and Reports.Java).
- Interactive Charts - You can now view reports with drill-down charts (Feature added to Reports.Web and Reports.Java).
- Interactive Reports - You can now drill-down, collapse, sort, bookmark, hyperlink and tag data within a report (Feature added to Reports.Web).
- Indicators in Component Editors - If a tab is used, it will be marked with an indicator in the editor.
- Open Button in Viewer - Using this button you can load a previously rendered and saved report (Feature added to Reports.Web and Reports.Java).
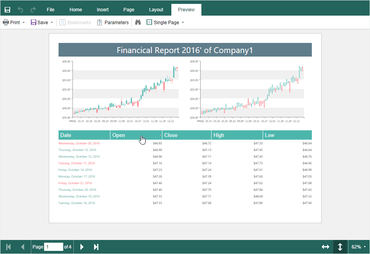
- Continuous Page View - In the report viewer, a new mode to view reports has been added. Upload the report to the viewer, enable the Continuous mode and then scroll the report up or down (Feature added to Reports.JS and Reports.Java).
- PostgreSQL Adapter in ASP.NET Core Designer - Now you can create a PostgreSQL data source and build reports based on this source.
- Style Conditions - Add style conditions, dependent on location, type or component name to which style will apply.
- Setup Toolbar in Report Designer - The toolbox contains all the components used to develop a report. All components are grouped by type – Bands, Cross Bands, Components, Primitives. Using the Setup Toolbox button, you can customize the shortcut to the components and enable or disable the Insert tab or toolbox (Feature added to Reports.Web, Reports.JS and Reports.Java).
↧
↧
Interactive reports.Adds interaction to reports including drill-down, sorting, bookmarks and more.
Features
- Publishing Reports - A new report publishing wizard has been added to the report designer. It helps the process of integrating reports into applications on various platforms.
- Stimulsoft Cloud - New cloud-based service for creating, storing, and deploying reports in your applications.
- Store Reports in Stimulsoft Cloud - Save reports from the standalone report designer to Stimulsoft Cloud.
- SVG Images - You can now use SVG images in reports.
- New WebDesigner Component - This component is a universal full-featured tool for creating reports. It was developed using HTML5 and CSS3 technologies and supports any web browser.
- Added Page Tab to Web Designer - This tab contains commands to quickly manage report templates. You can define page borders, orientation, size, add columns to the page, call the watermark editor, enable displaying a grid, align the selected components to the grid, hide or show the headers of components.
- Interactive Charts - You can now view reports with drill-down charts.
- Interactive Reports - You can now drill-down, collapse, sort, bookmark, hyperlink and tag data within a report.
- Indicators in Component Editors - If a tab is used, it will be marked with an indicator in the editor.
- Open Button in Viewer - Using this button you can load a previously rendered and saved report.
- Continuous Page View - In the report viewer, a new mode to view reports has been added. Upload the report to the viewer, enable the Continuous mode and then scroll the report up or down.
- PostgreSQL Adapter in ASP.NET Core Designer - Now you can create a PostgreSQL data source and build reports based on this source.
- Setup Toolbar in Report Designer - The toolbox contains all the components used to develop a report. All components are grouped by type – Bands, Cross Bands, Components, Primitives. Using the Setup Toolbox button, you can customize the shortcut to the components and enable or disable the Insert tab or toolbox.
↧
Preview reports in a JavaScript viewer.Preview reports with JavaScript viewer in WinForms and WPF report designers.
Features
- Publishing Reports - A new report publishing wizard has been added to the report designer. It helps the process of integrating reports into applications on various platforms.
- Stimulsoft Cloud - New cloud-based service for creating, storing, and deploying reports in your applications.
- Store Reports in Stimulsoft Cloud - Save reports from the standalone report designer to Stimulsoft Cloud.
- SVG Images - You can now use SVG images in reports.
- JS Preview in Designer - When developing reports in the WinForms and WPF report designers, you can now preview the report in a JavaScript viewer.
- Indicators in Component Editors - If a tab is used, it will be marked with an indicator in the editor.
↧
Stimulsoft Cloud.Includes new cloud-based service for creating, storing, and deploying reports in your applications.
Features
- Publishing Reports - A new report publishing wizard has been added to the report designer. It helps the process of integrating reports into applications on various platforms.
- Stimulsoft Cloud - New cloud-based service for creating, storing, and deploying reports in your applications.
- Store Reports in Stimulsoft Cloud - Save reports from the standalone report designer to Stimulsoft Cloud.
- SVG Images - You can now use SVG images in reports.
- Indicators in Component Editors - If a tab is used, it will be marked with an indicator in the editor.
↧
↧
Continuous page view.Adds continuous mode in Report Viewer to scroll up or down report.
Features
- Publishing Reports - A new report publishing wizard has been added to the report designer. It helps the process of integrating reports into applications on various platforms.
- Stimulsoft Cloud - New cloud-based service for creating, storing, and deploying reports in your applications.
- Store Reports in Stimulsoft Cloud - Save reports from the standalone report designer to Stimulsoft Cloud.
- SVG Images - You can now use SVG images in reports.
- Added Page Tab to Web Designer - This tab contains commands to quickly manage report templates. You can define page borders, orientation, size, add columns to the page, call the watermark editor, enable displaying a grid, align the selected components to the grid, hide or show the headers of components.
- Interactive Charts - You can now view reports with drill-down charts.
- Indicators in Component Editors - If a tab is used, it will be marked with an indicator in the editor.
- Open Button in Viewer - Using this button you can load a previously rendered and saved report.
- Continuous Page View - In the report viewer, a new mode to view reports has been added. Upload the report to the viewer, enable the Continuous mode and then scroll the report up or down.
- Setup Toolbar in Report Designer - The toolbox contains all the components used to develop a report. All components are grouped by type – Bands, Cross Bands, Components, Primitives. Using the Setup Toolbox button, you can customize the shortcut to the components and enable or disable the Insert tab or toolbox.
↧
SVG image in a report.Insert SVG images via the Image Component or as a Watermark for report pages.
Features
- Publishing Reports - A new report publishing wizard has been added to the report designer. It helps the process of integrating reports into applications on various platforms.
- Stimulsoft Cloud - New cloud-based service for creating, storing, and deploying reports in your applications.
- Store Reports in Stimulsoft Cloud - Save reports from the standalone report designer to Stimulsoft Cloud.
- SVG Images - You can now use SVG images in reports.
- Indicators in Component Editors - If a tab is used, it will be marked with an indicator in the editor.
↧
Set style conditions.Add style conditions, dependent on location, type or component name to which style will apply.
Features
- Publishing Reports - A new report publishing wizard has been added to the report designer. It helps the process of integrating reports into applications on various platforms.
- Stimulsoft Cloud - New cloud-based service for creating, storing, and deploying reports in your applications.
- Store Reports in Stimulsoft Cloud - Save reports from the standalone report designer to Stimulsoft Cloud.
- SVG Images - You can now use SVG images in reports.
- Added Page Tab to Web Designer - This tab contains commands to quickly manage report templates. You can define page borders, orientation, size, add columns to the page, call the watermark editor, enable displaying a grid, align the selected components to the grid, hide or show the headers of component.
- Indicators in Component Editors - If a tab is used, it will be marked with an indicator in the editor.
- Continuous Page View - In the report viewer, a new mode to view reports has been added. Upload the report to the viewer, enable the Continuous mode and then scroll the report up or down.
- Style Conditions - Add style conditions, dependent on location, type or component name to which style will apply.
- Setup Toolbar in Report Designer - The toolbox contains all the components used to develop a report. All components are grouped by type – Bands, Cross Bands, Components, Primitives. Using the Setup Toolbox button, you can customize the shortcut to the components and enable or disable the Insert tab or toolbox.
↧
Preview reports in a JavaScript viewer.Adds JavaScript report preview in WinForms and WPF report designers.
Features
- Publishing Reports - A new report publishing wizard has been added to the report designer. It helps the process of integrating reports into applications on various platforms.
- Stimulsoft Cloud - New cloud-based service for creating, storing, and deploying reports in your applications.
- Store Reports in Stimulsoft Cloud - Save reports from the standalone report designer to Stimulsoft Cloud.
- SVG Images - You can now use SVG images in reports.
- JS Preview in Designer - When developing reports in the WinForms and WPF report designers, you can now preview the report in a JavaScript viewer.
- Indicators in Component Editors - If a tab is used, it will be marked with an indicator in the editor.
↧
↧
December 5, 2017, 7:38 am
New Wizards for Creating ReportsNew report wizards allow you to easily create Invoices, Orders and Quotes.
Features
- New Wizards for Creating Reports - New report wizards have been added that allow you to create Invoices, Orders and Quotes. After creating the report, you can edit the template in the report designer.
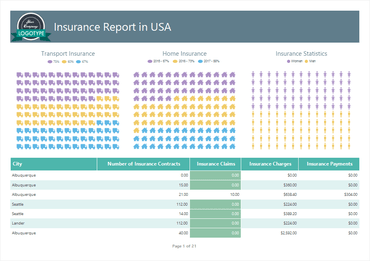
- Pictorial Chart - To visualize the values in this chart, various icons are used. For each row of the chart, you can specify an icon.
- Mobile Mode for HTML5 Viewer - In this release, the HTML5 viewer has been adapted to work on mobile devices. You can now view reports and export them directly from your mobile device.
- Settings in the Data Dictionary - All data dictionary settings are now shown in a separate menu.
- Report Designer Notification Menu - Allows you to see information about the release of new versions, as well as expiration of your Stimulsoft subscription.
↧
December 5, 2017, 7:55 am
Pictorial ChartAdds new Pictorial Chart report.
Features
- New Wizards for Creating Reports - New report wizards have been added that allow you to create Invoices, Orders and Quotes. After creating the report, you can edit the template in the report designer.
- Pictorial Chart - To visualize the values in this chart, various icons are used. For each row of the chart, you can specify an icon.
- Mobile Mode for HTML5 Viewer - In this release, the HTML5 viewer has been adapted to work on mobile devices. You can now view reports and export them directly from your mobile device.
- Settings in the Data Dictionary - All data dictionary settings are now shown in a separate menu.
- Report Designer Notification Menu - Allows you to see information about the release of new versions, as well as expiration of your Stimulsoft subscription.
↧
December 5, 2017, 8:01 am
New Wizards for Creating ReportsNew report wizards allow you to easily create Invoices, Orders and Quotes.
Features
- New Wizards for Creating Reports - New report wizards have been added that allow you to create Invoices, Orders and Quotes. After creating the report, you can edit the template in the report designer.
- Pictorial Chart - To visualize the values in this chart, various icons are used. For each row of the chart, you can specify an icon.
- Mobile Mode for HTML5 Viewer - In this release, the HTML5 viewer has been adapted to work on mobile devices. You can now view reports and export them directly from your mobile device.
- Settings in the Data Dictionary - All data dictionary settings are now shown in a separate menu.
- Report Designer Notification Menu - Allows you to see information about the release of new versions, as well as expiration of your Stimulsoft subscription.
↧
December 5, 2017, 8:07 am
Pictorial Chart reportAdds new Pictorial Chart report.
Features
- New Wizards for Creating Reports - New report wizards have been added that allow you to create Invoices, Orders and Quotes. After creating the report, you can edit the template in the report designer.
- Pictorial Chart - To visualize the values in this chart, various icons are used. For each row of the chart, you can specify an icon.
- Mobile Mode for HTML5 Viewer - In this release, the HTML5 viewer has been adapted to work on mobile devices. You can now view reports and export them directly from your mobile device.
- Settings in the Data Dictionary - All data dictionary settings are now shown in a separate menu.
- Report Designer Notification Menu - Allows you to see information about the release of new versions, as well as expiration of your Stimulsoft subscription.
↧
↧
December 5, 2017, 8:11 am
New Insert TabNew Insert Tab contains all the components needed to develop a report, grouped by type.
Features
- New Wizards for Creating Reports - New report wizards have been added that allow you to create Invoices, Orders and Quotes. After creating the report, you can edit the template in the report designer.
- Pictorial Chart - To visualize the values in this chart, various icons are used. For each row of the chart, you can specify an icon.
- Mobile Mode for HTML5 Viewer - In this release, the HTML5 viewer has been adapted to work on mobile devices. You can now view reports and export them directly from your mobile device.
- Automatically Check Expressions - When you change an expression, it is now automatically checked. If there is an error it is displayed in the text editor.
- New Insert Tab - This tab contains all the components needed to develop a report, grouped by type.
- Settings in the Data Dictionary - All data dictionary settings are now shown in a separate menu.
- Report Designer Notification Menu - Allows you to see information about the release of new versions, as well as expiration of your Stimulsoft subscription.
↧
December 5, 2017, 8:13 am
Stimulsoft Reports.UltimateAdds native .NET Core support.
Features
- Native .NET Core Support - Includes a report designer and easy-to-use tools for report exporting and printing.
- New Wizards for Creating Reports - New report wizards have been added that allow you to create Invoices, Orders and Quotes. After creating the report, you can edit the template in the report designer.
- Pictorial Chart - To visualize the values in this chart, various icons are used. For each row of the chart, you can specify an icon.
- Mobile Mode for HTML5 Viewer - In this release, the HTML5 viewer has been adapted to work on mobile devices. You can now view reports and export them directly from your mobile device.
- Automatically Check Expressions - When you change an expression, it is now automatically checked. If there is an error it is displayed in the text editor.
- New Insert Tab - This tab contains all the components needed to develop a report, grouped by type.
- Settings in the Data Dictionary - All data dictionary settings are now shown in a separate menu.
- Report Designer Notification Menu - Allows you to see information about the release of new versions, as well as expiration of your Stimulsoft subscription.
↧
December 5, 2017, 8:17 am
Stimulsoft Reports.WebAdds native .NET Core support.
Features
- Native .NET Core Support - Includes a report designer and easy-to-use tools for report exporting and printing.
- New Wizards for Creating Reports - New report wizards have been added that allow you to create Invoices, Orders and Quotes. After creating the report, you can edit the template in the report designer.
- Pictorial Chart - To visualize the values in this chart, various icons are used. For each row of the chart, you can specify an icon.
- Mobile Mode for HTML5 Viewer - In this release, the HTML5 viewer has been adapted to work on mobile devices. You can now view reports and export them directly from your mobile device.
- Settings in the Data Dictionary - All data dictionary settings are now shown in a separate menu.
- Report Designer Notification Menu - Allows you to see information about the release of new versions, as well as expiration of your Stimulsoft subscription.
↧
December 5, 2017, 8:26 am
Automatically Check ExpressionsAutomatically check expressions when creating reports.
Features
- New Wizards for Creating Reports - New report wizards have been added that allow you to create Invoices, Orders and Quotes. After creating the report, you can edit the template in the report designer.
- Pictorial Chart - To visualize the values in this chart, various icons are used. For each row of the chart, you can specify an icon.
- Mobile Mode for HTML5 Viewer - In this release, the HTML5 viewer has been adapted to work on mobile devices. You can now view reports and export them directly from your mobile device.
- Automatically Check Expressions - When you change an expression, it is now automatically checked. If there is an error it is displayed in the text editor.
- Settings in the Data Dictionary - All data dictionary settings are now shown in a separate menu.
- Report Designer Notification Menu - Allows you to see information about the release of new versions, as well as expiration of your Stimulsoft subscription.
↧
↧
Report resource documentsReport resource documents (PDF, Word, Excel, etc.) and images can now be displayed in the viewer.
Features
- Resource Panel in Viewer - Report resource documents (PDF, Word, Excel, etc.) and images can now be displayed in the viewer.
- Custom Fonts in Reports - 2018.2 adds the ability to use custom fonts in reports.
- New Style Editor - The style editor has been completely redesigned:
- Collections and styles are now displayed in a hierarchical form.
- Use drag and drop to change the collection for the style.
- Added filters and sorting styles.
- All styles used in a report are checked with markers in the style editor.
- Search for a style by name or part of name.
- Refresh Time for Reports - Define an interval after which the report will be rebuilt. In addition to the preset values, you can enter custom values.
- Access to Reports - You can configure remote access to the report preview from the designer.
- Sub-reports from Resources - Add other reports (mrt, mrz, mdc, mdz) as report resources, and use these built-in reports in the Sub-Report component.
- Interactive Chart in Reports.JS - You can now view reports with interactive data in charts.
- Text Files in Report Resources - You can now add text files (txt, rtf) as report resources, and then display them in the report using the RichText component.
- Dragging Data to a Dictionary - When dragging a data file to the dictionary there are various options for adding it. If the file is dragged to the top of the dictionary, a new data source will be created based on this file. If you drag the data file to the bottom of the dictionary, the data file will be added as report resource.
- Move to Resources Command - When creating file data sources you can now move them to report resources.
- Saving Resources - 2018.2 adds the ability to save resources to a file.
- New Command for Resources - The New Data Source [resource name] command has been added to the data dictionary. This command is only active for resources that contain data files.
- Search for Items in Parameters - If the number of parameter values is greater than 10, the search field will be displayed in the list of values. Enter a symbol, a part of a value or an entire value, and the list of parameter values will be filtered in real time.
- New Barcode Editor - 2018.2 improves the Barcode component editor.
- New Shape Menu - All primitives are now grouped in one menu and are split by shape type.
- New Status Bar - The WinForms designer now has a redesigned status panel for the preview and report designer.
↧
Custom fonts in reportsUse custom fonts in reports.
Features
- Resource Panel in Viewer - Report resource documents (PDF, Word, Excel, etc.) and images can now be displayed in the viewer.
- Custom Fonts in Reports - 2018.2 adds the ability to use custom fonts in reports.
- New Style Editor - The style editor has been completely redesigned:
- Collections and styles are now displayed in a hierarchical form.
- Use drag and drop to change the collection for the style.
- Added filters and sorting styles.
- All styles used in a report are checked with markers in the style editor.
- Search for a style by name or part of name.
- Refresh Time for Reports - Define an interval after which the report will be rebuilt. In addition to the preset values, you can enter custom values.
- Access to Reports - You can configure remote access to the report preview from the designer.
- Sub-reports from Resources - Add other reports (mrt, mrz, mdc, mdz) as report resources, and use these built-in reports in the Sub-Report component.
- Text Files in Report Resources - You can now add text files (txt, rtf) as report resources, and then display them in the report using the RichText component.
- Dragging Data to a Dictionary - When dragging a data file to the dictionary there are various options for adding it. If the file is dragged to the top of the dictionary, a new data source will be created based on this file. If you drag the data file to the bottom of the dictionary, the data file will be added as report resource.
- Move to Resources Command - When creating file data sources you can now move them to report resources.
- Saving Resources - 2018.2 adds the ability to save resources to a file.
- New Command for Resources - The New Data Source [resource name] command has been added to the data dictionary. This command is only active for resources that contain data files.
- Search for Items in Parameters - If the number of parameter values is greater than 10, the search field will be displayed in the list of values. Enter a symbol, a part of a value or an entire value, and the list of parameter values will be filtered in real time.
- New Barcode Editor - 2018.2 improves the Barcode component editor.
- New Shape Menu - All primitives are now grouped in one menu and are split by shape type.
↧
New Style EditorAdds new Report Style Editor.
Features
- Resource Panel in Viewer - Report resource documents (PDF, Word, Excel, etc.) and images can now be displayed in the viewer.
- Custom Fonts in Reports - 2018.2 adds the ability to use custom fonts in reports.
- New Style Editor - The style editor has been completely redesigned:
- Collections and styles are now displayed in a hierarchical form.
- Use drag and drop to change the collection for the style.
- Added filters and sorting styles.
- All styles used in a report are checked with markers in the style editor.
- Search for a style by name or part of name.
- Refresh Time for Reports - Define an interval after which the report will be rebuilt. In addition to the preset values, you can enter custom values.
- Access to Reports - You can configure remote access to the report preview from the designer.
- Sub-reports from Resources - Add other reports (mrt, mrz, mdc, mdz) as report resources, and use these built-in reports in the Sub-Report component.
- Text Files in Report Resources - You can now add text files (txt, rtf) as report resources, and then display them in the report using the RichText component.
- Dragging Data to a Dictionary - When dragging a data file to the dictionary there are various options for adding it. If the file is dragged to the top of the dictionary, a new data source will be created based on this file. If you drag the data file to the bottom of the dictionary, the data file will be added as report resource.
- Move to Resources Command - When creating file data sources you can now move them to report resources.
- Saving Resources - 2018.2 adds the ability to save resources to a file.
- New Command for Resources - The New Data Source [resource name] command has been added to the data dictionary. This command is only active for resources that contain data files.
- Search for Items in Parameters - If the number of parameter values is greater than 10, the search field will be displayed in the list of values. Enter a symbol, a part of a value or an entire value, and the list of parameter values will be filtered in real time.
- New Barcode Editor - 2018.2 improves the Barcode component editor.
- New Shape Menu - All primitives are now grouped in one menu and are split by shape type.
↧